PerfScope Request access

Every frame of your game, on the record.

PerfScope profiles Android and iOS games on real phones: frame time, jank, 1% lows, CPU, GPU, memory, heat and power. Its helper costs the phone 0.12% of its CPU, about 0.36 points all-in over Wi-Fi, measured on a Galaxy A26, not claimed.

  • No SDK in your game
  • No root, no jailbreak
  • N/A, never a guess
TitleSkyline Rally 1.4.0
DeviceGalaxy A26 5G
OSAndroid 16
Sampling1 Hz · 5 min
DataSample
Avg FPS59.4
1% low39.8
Jank / 10 min14.0
Stutter0.34%
Worst frame152 ms

Sample session generated for this page: the game, numbers and frames are synthetic, recorded with PerfScope's real charts.

0.36 points. Invisible to the game.

A profiler that slows the game down measures itself. PerfScope runs one small helper as the phone's shell user, reads the counters the system already keeps, and does every calculation on your computer. Then it proves the cost with its own A/B benchmark: the same scene with the collector off and on, alternating.

Extra device CPU while profilingpercentage points of the whole phone, from PerfScope's own off/on benchmark
Helper probe Galaxy A26 · Wi-Fi0.155
adb connection Galaxy A26 · Wi-Fi0.05
Wi-Fi radio & driver Galaxy A26 · Wi-Fi0.15
Total, Android Galaxy A26 · Wi-Fi≈0.36
Total, iOS iPhone 15 · 2 s sampling≈0.57

Dashed line: the 1-point limit the benchmark enforces. The bars run to 1 pt.

Every collector change has to pass

FPS changeunder 1%PASS
Device CPU changeunder 1 ptPASS
SoC temperature riseunder 0.5 °CPASS
PerfScope's own costunder 1%PASS

Windows alternate off and on (ABBA) with identical bookends, so drift can't hide a cost.

Record. Mark. Compare. Share.

The loop a QA team runs on every build, in one desktop app for Mac and Windows. Plug the phone in over USB or Wi-Fi, pick the game, press Start.

01 Watch it live

Every second: FPS and frame times straight from the system compositor, jank by PerfDog's definitions, app and device CPU, per-cluster clocks and throttling, GPU, memory, heat and power. Screenshots follow the chart cursor, so a spike comes with the frame that caused it.

PerfScope's Live page: tiles for FPS, 1% low, jank, CPU, GPU, memory, temperature and power above FPS and frame-time charts, with a column of game screenshots
Sample data: a fictional game on a demo setup
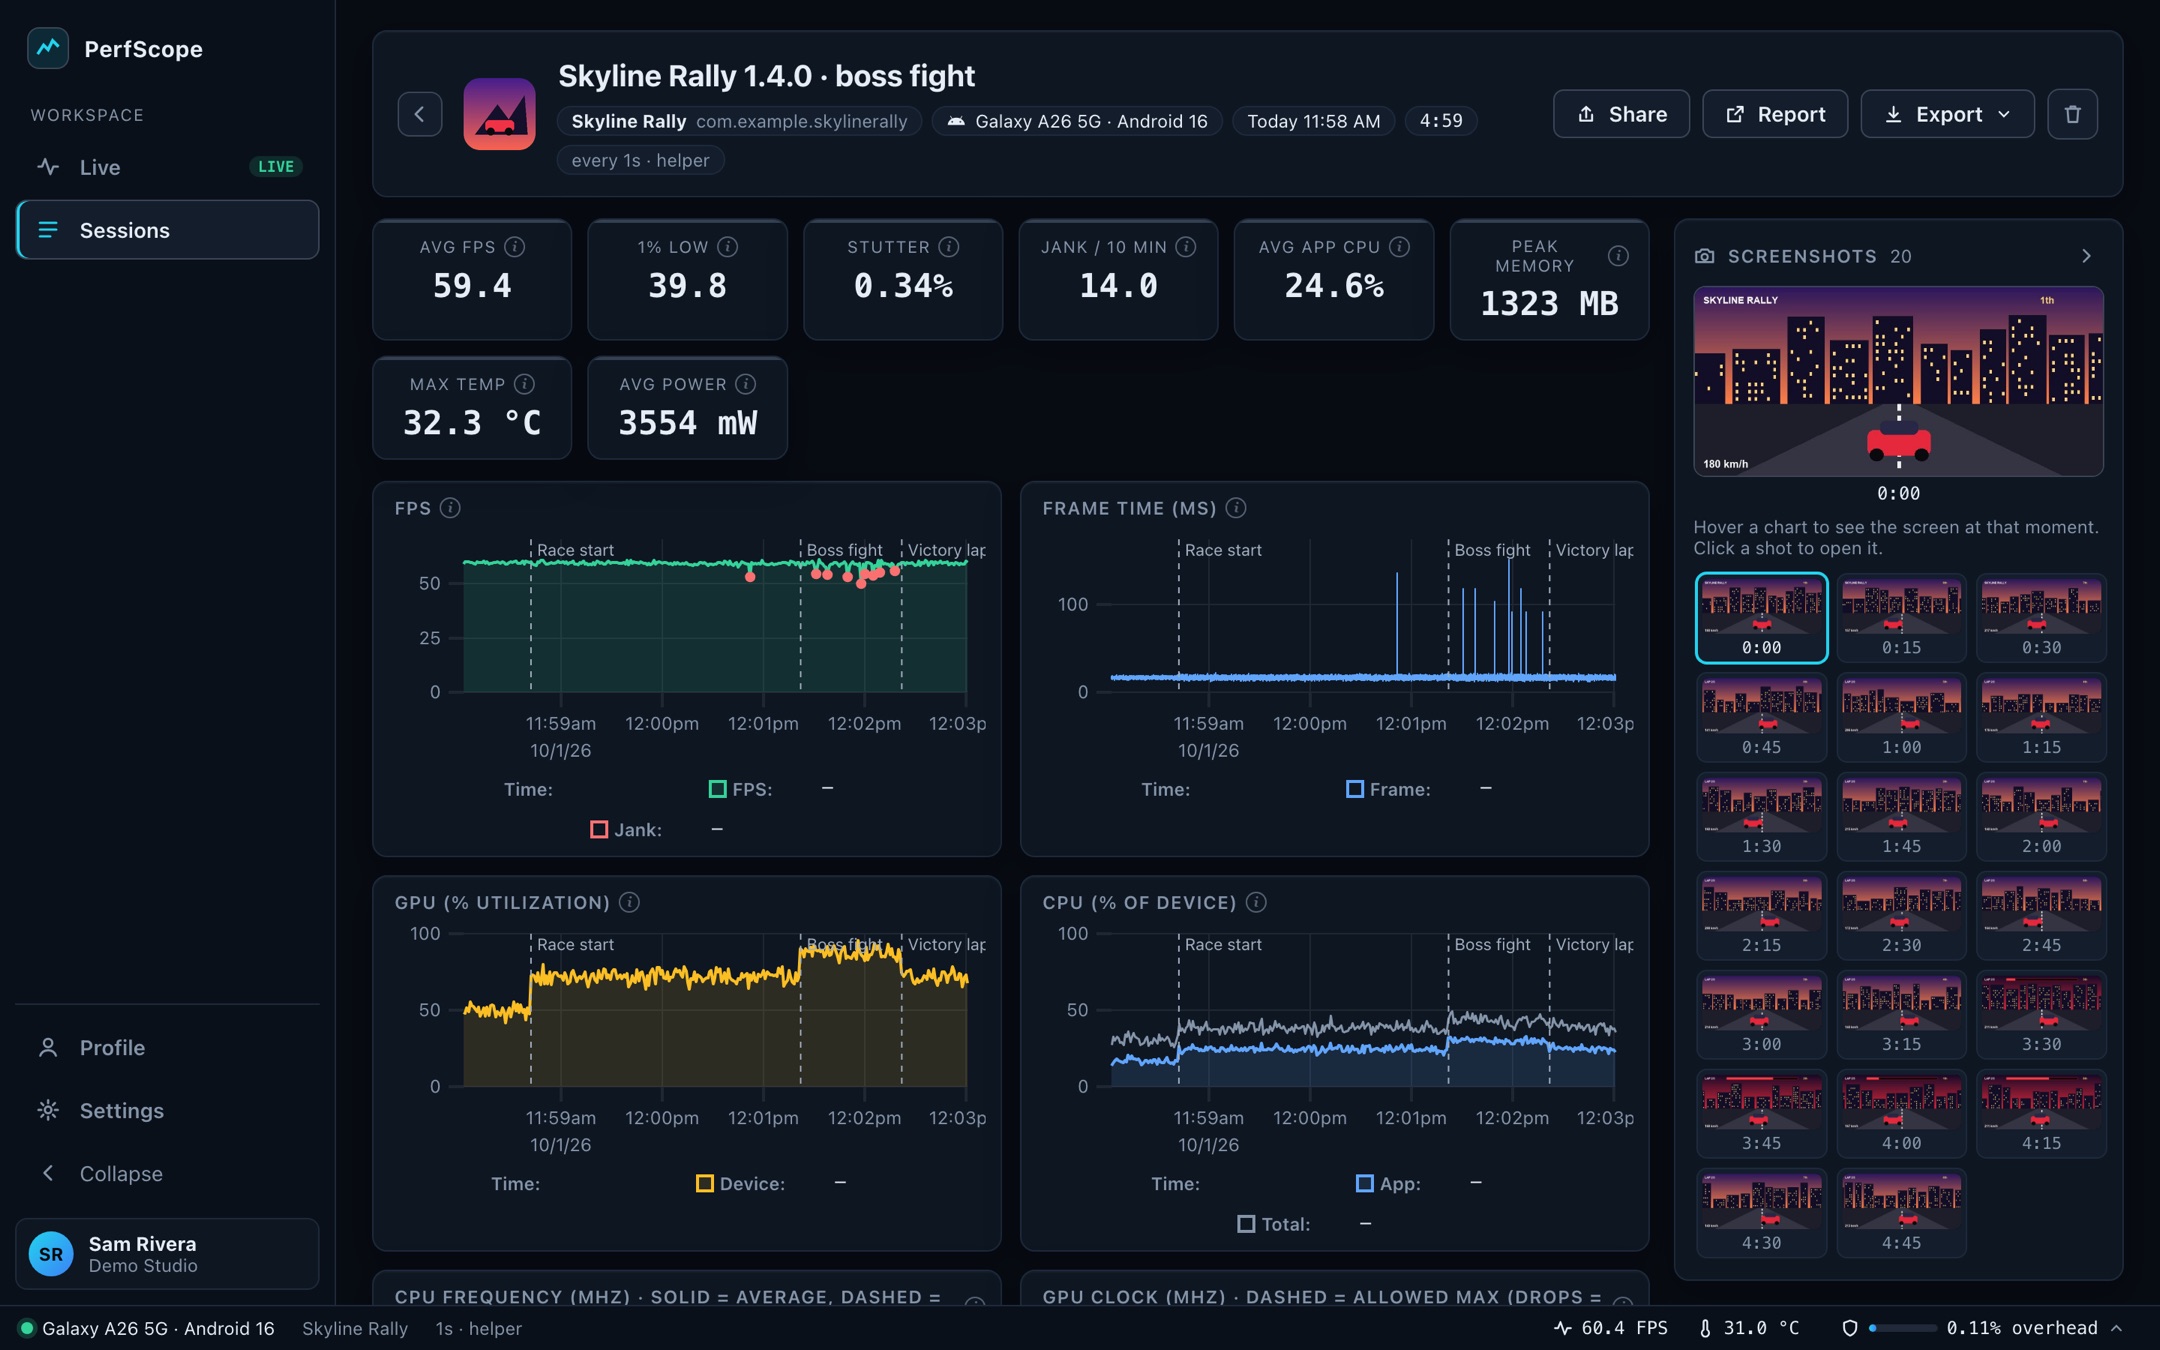
A recorded session: headline stats, charts with Race start, Boss fight and Victory lap markers, and screenshots
Sample data: a fictional game on a demo setup

02 Mark the scenes that matter

Press M during the boss fight. Each marker starts a segment with its own average FPS, 1% low and jank rate, so the report says which scene broke, not just that something did.

03 Compare builds, frame for frame

Line two recordings up by elapsed time. Every stat gets a difference, coloured only when it survives rounding: green when the new build is better, red when it regressed.

1.4.01.3.2Sample data
PerfScope HTML report with headline stats, charts and a summary table
Sample data: a fictional game on a demo setup

04 Share the evidence

Export a single-file HTML report, CSV or JSON, or share a link anyone can open on perfscope.site. Every stat carries an explanation, so producers read the same numbers engineers do. Links are snapshots, and you can revoke them.

What it measures, and where it can't.

An honest profiler says N/A. When a phone doesn't expose a number, PerfScope shows the gap instead of filling it.

MetricAndroidiOS
FPSFrom the compositor, per game layerWhile the game is in front
Frame times, jank, 1% low, stutterEvery frameAfter recording, with Xcode installed
App and device CPUAll of the game's processesShare of all cores
CPU clocks and throttlingPer cluster, with the allowed maxN/A
GPULoad and clock (Mali)Device, render and tiler
MemoryRSS and memory leftFootprint and memory left
TemperatureSoC sensor, thermal statusBattery
Battery powerOn battery (use Wi-Fi)On battery
NetworkWhole device, minus PerfScopeWhole device, minus this computer
ScreenshotsOptional, on the phoneOptional

MeasuredPartlyNot available

Your sessions stay yours.

Recordings live on your computer. Sign in with Google and they back up to a PerfScope folder in your own Drive and appear on your other computers; PerfScope can only see the files it created there. Nothing is uploaded anywhere else unless you press Share.

On the test bench.

Every number on this page was measured on these phones. Each new device gets its quirks captured and tested before it's called supported.

Galaxy A26 5G
OS
Android 16
Chip
Exynos 1380
GPU
Mali-G68 MP5
Display
120 Hz
Galaxy A51
OS
Android 13
Model
SM-A515F
Quirk
Reports current in mA
Power
Detected and corrected
iPhone 15
OS
iOS 18.3
Cores
6
Connection
Native tunnel, no root
Sampling
every 2 s

Put your next build on the record.

PerfScope isn't publicly downloadable yet. Tell me about your game, your team and the phones you test on, and I'll get back to you.

Request access

abozaid1998.mma@gmail.com